plotIR.py
usage: plotIR.py [-h] [-o OUTFILE] [-t {transmittance,absorbance,vcd,raman}]
                 [-na] [-p {pseudo-voigt,gaussian,lorentzian,delta}]
                 [-m VOIGT_MIXING] [-fwhm FWHM] [-s POINT_SPACING]
                 [-l LINEAR_SCALE] [-q QUADRATIC_SCALE] [-nr] [-sc CENTERS]
                 [-sw WIDTHS] [-r RANGES] [-fw FIG_WIDTH] [-fh FIG_HEIGHT]
                 [-csv EXP_DATA [EXP_DATA ...]] [-rx]
                 files [files ...]

plot IR spectrum

positional arguments:
  files                 frequency job output file(s)

optional arguments:
  -h, --help            show this help message and exit
  -o OUTFILE, --output OUTFILE
                        output destination
                        Default: show plot
  -t {transmittance,absorbance,vcd,raman}, --plot-type {transmittance,absorbance,vcd,raman}
                        type of plot
                        Default: transmittance
  -na, --harmonic       force to use harmonic frequencies when anharmonic data is in the file
  -s POINT_SPACING, --point-spacing POINT_SPACING
                        spacing between each x value
                        Default: a non-uniform spacing that is more dense near peaks
  -nr, --no-reverse     do not reverse x-axis
  -fw FIG_WIDTH, --figure-width FIG_WIDTH
                        width of figure in inches
  -fh FIG_HEIGHT, --figure-height FIG_HEIGHT
                        height of figure in inches
  -csv EXP_DATA [EXP_DATA ...], --experimental-csv EXP_DATA [EXP_DATA ...]
                        CSV file containing observed spectrum data, which will be plotted on top
                        frequency job files should not come directly after this flag
  -rx, --rotate-x-ticks
                        rotate x-axis tick labels by 45 degrees

peak options:
  -p {pseudo-voigt,gaussian,lorentzian,delta}, --peak-type {pseudo-voigt,gaussian,lorentzian,delta}
                        function for peaks
                        Default: pseudo-voigt
  -m VOIGT_MIXING, --voigt-mixing VOIGT_MIXING
                        fraction of pseudo-Voigt that is Gaussian
                        Default: 0.5
  -fwhm FWHM, --full-width-half-max FWHM
                        full width at half max. of peaks
                        Default: 15 cm^-1

scale frequencies:
  -l LINEAR_SCALE, --linear-scale LINEAR_SCALE
                        subtract linear_scale * frequency from each mode (i.e. this is 1 - λ)
                        Default: 0 (no scaling)
  -q QUADRATIC_SCALE, --quadratic-scale QUADRATIC_SCALE
                        subtract quadratic_scale * frequency^2 from each mode
                        Default: 0 (no scaling)

x-centered interruptions:
  -sc CENTERS, --section-centers CENTERS
                        split plot into sections with a section centered on each of the specified values
                        values should be separated by commas
  -sw WIDTHS, --section-widths WIDTHS
                        width of each section specified by -c/--centers
                        should be separated by commas, with one for each section

x-range interruptions:
  -r RANGES, --ranges RANGES
                        split plot into sections (e.g. 0-1900,2900-3300)
Gallery
IR spectrum of a methyl lactate conformer
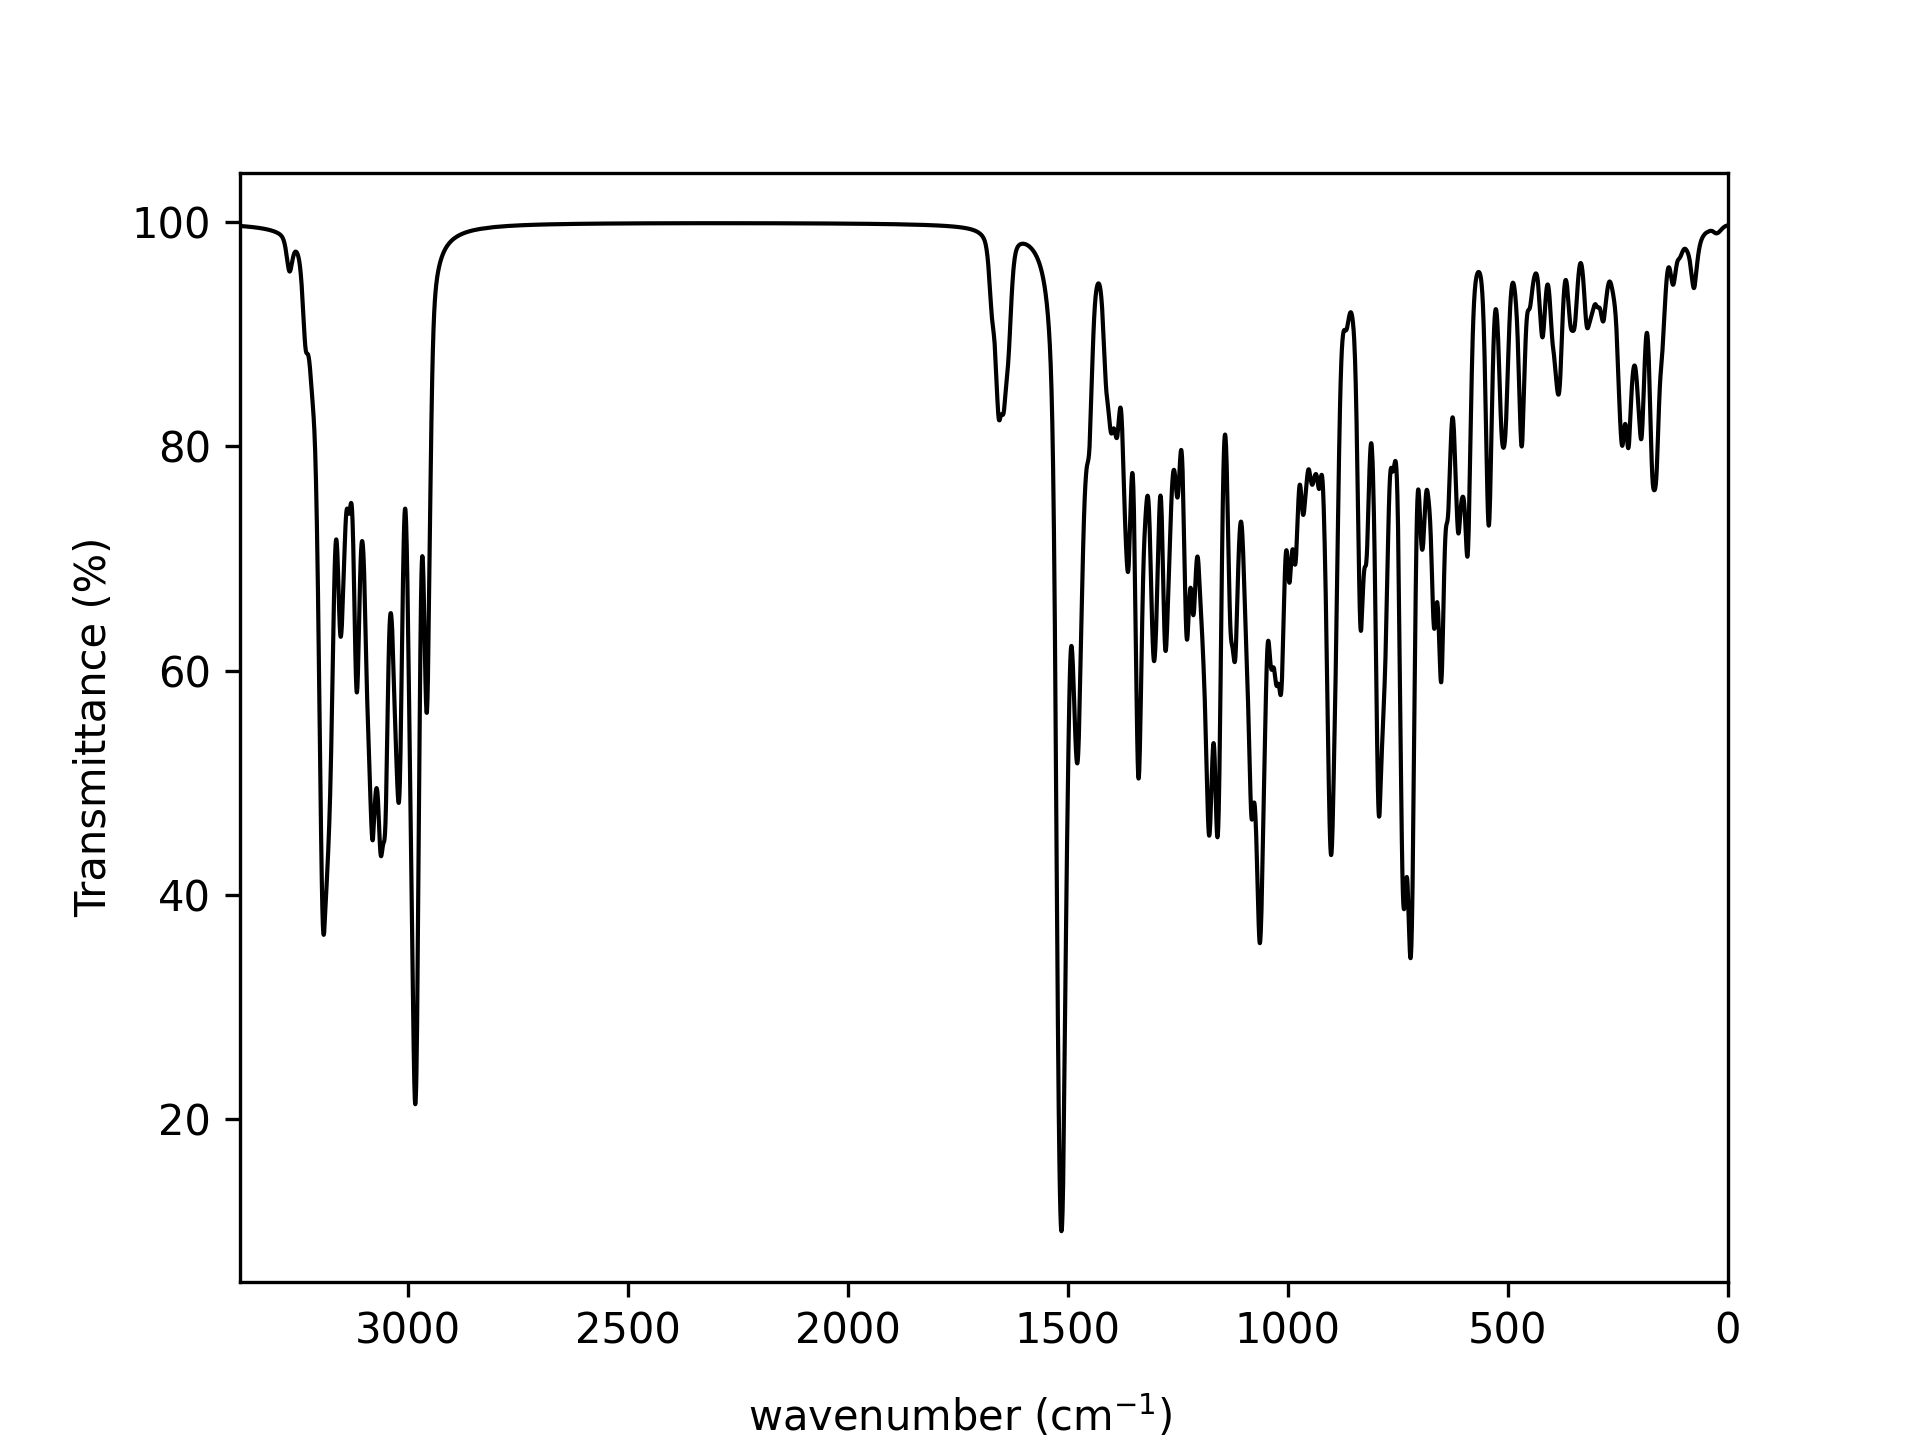
with less useful ranges cut out (-r 500-1750,2900-3350)
